Meeting Canary Tab
At a glance view of your meetings.
You can view your previous meetings from within Teams by going to Teams | Apps | Meeting Canary
You can also view this in the web browser by going to https://teamsapp.meetingcanary.com/
You can also view this tab at https://www.microsoft365.com/apps or https://outlook.office.com/ and select Apps from the side bar.
Meeting Canary Tab Page
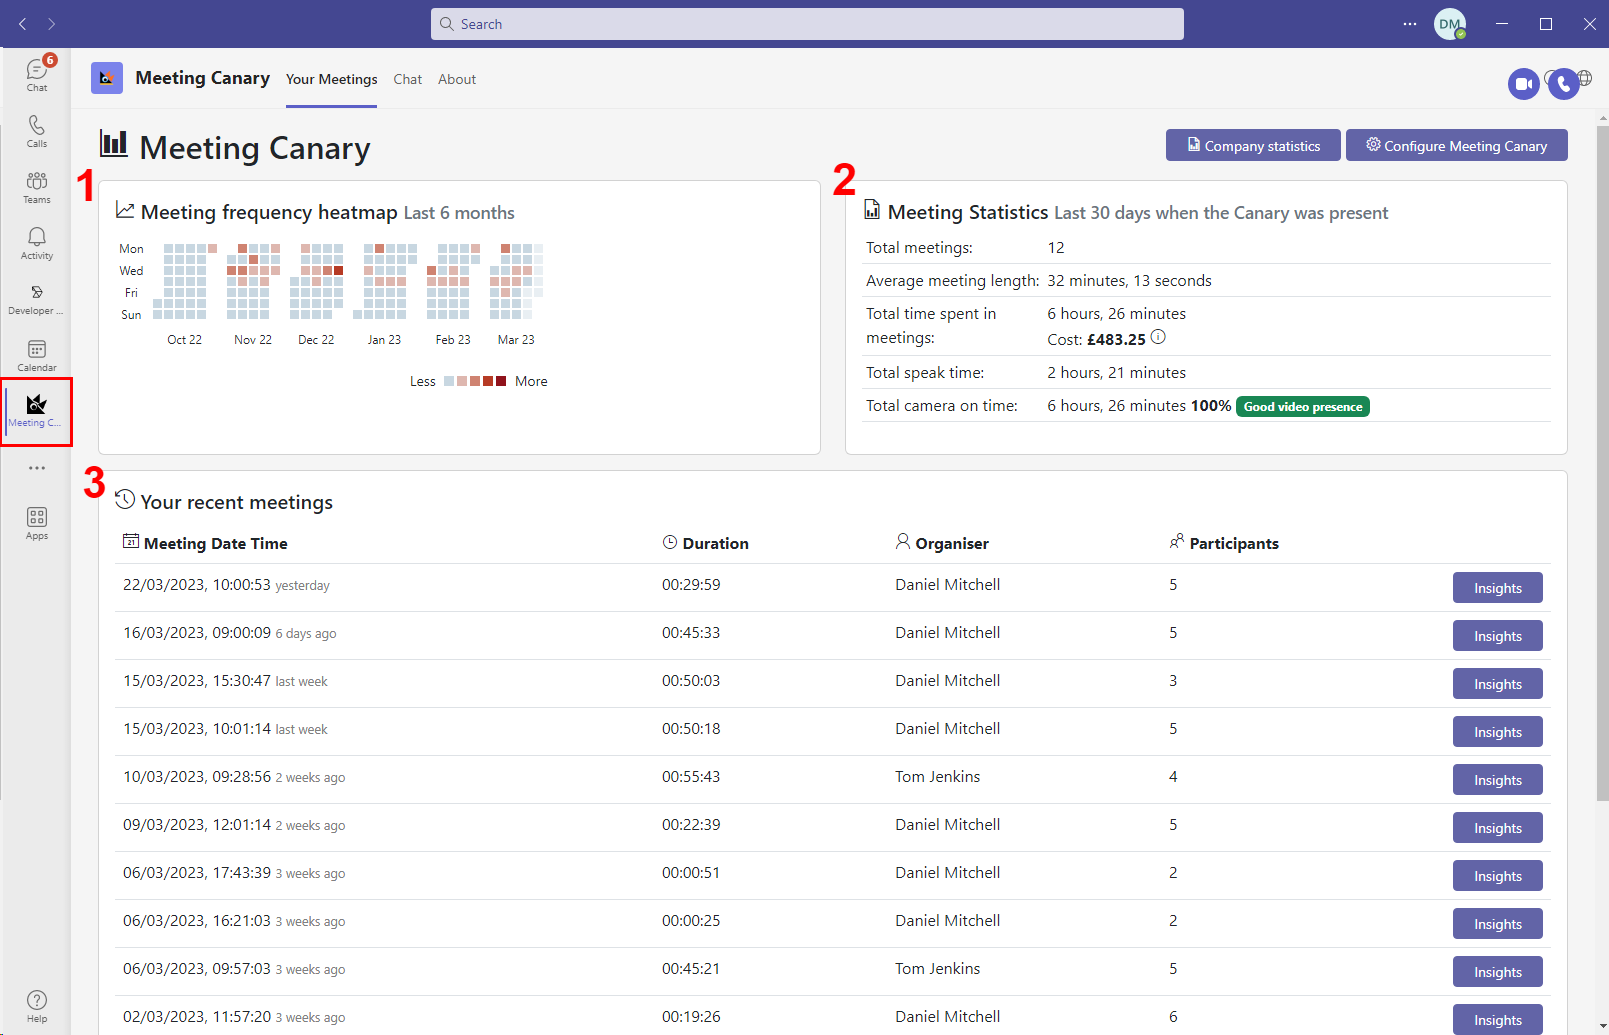
Clicking on the Meeting Canary tab will take you to a home screen, consisting of 3 areas.

1. Meeting Frequency HeatMap
View at a glance when you are having your meetings
2. Meeting Statistics
View a summary of your meeting activity over the last 30 days.
3. Your Recent Meetings
View a list of the last 15 meetings you have attended or were the organiser for. You can then drill down into each meeting to find out more information.
Insights Page

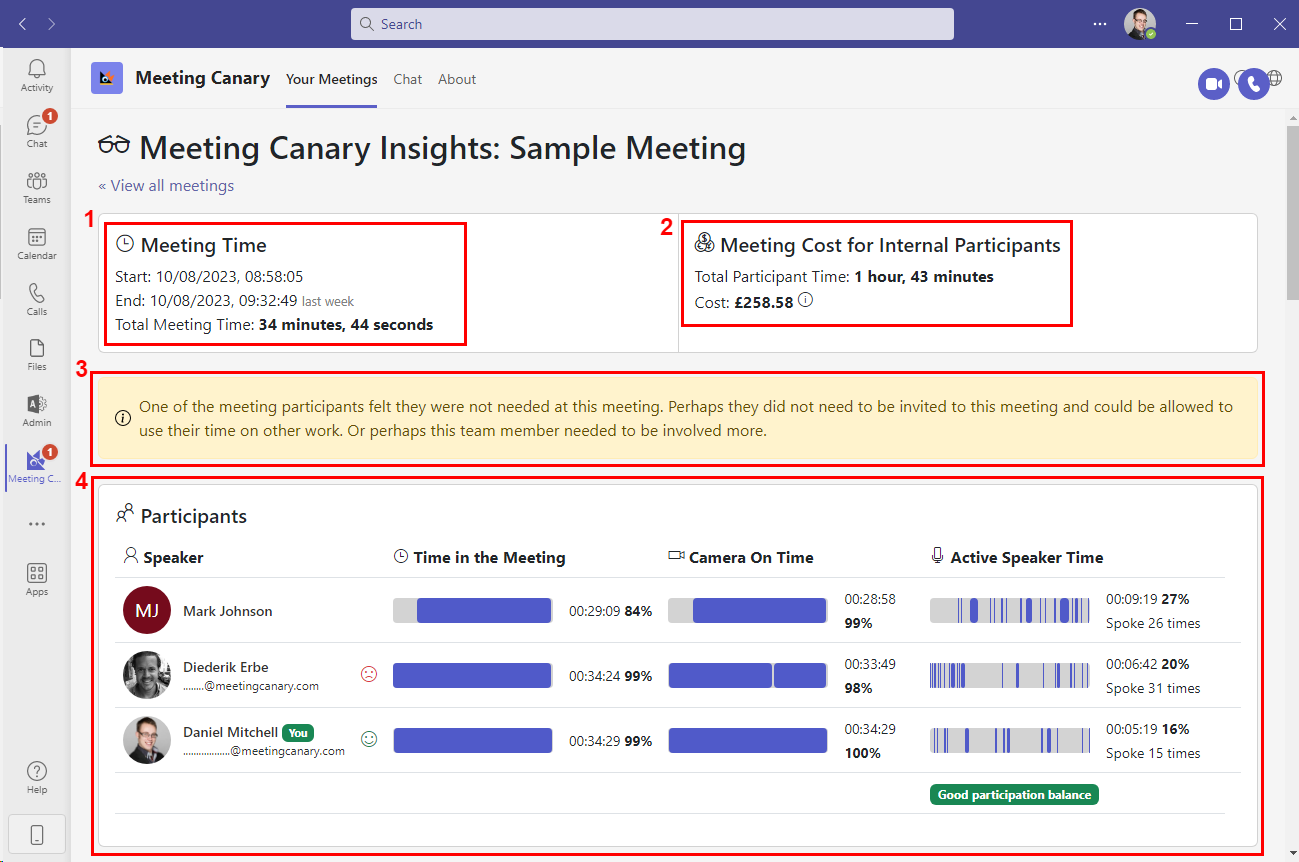
1. Meeting Time
Display time meeting started and finished. Display meeting length.
2. Meeting Cost for Internal Participant
Display the total cumulative time for participants and the cost of the meeting. See more information on how this is calculated see Meeting Cost
3. Meeting observations or tips
Receive generated observation about the meeting.
4. Participants
View all meeting participants, see when they:
- Joined and left the meeting.
- When they had their video camera on.
- Time spent as the Active Speaker
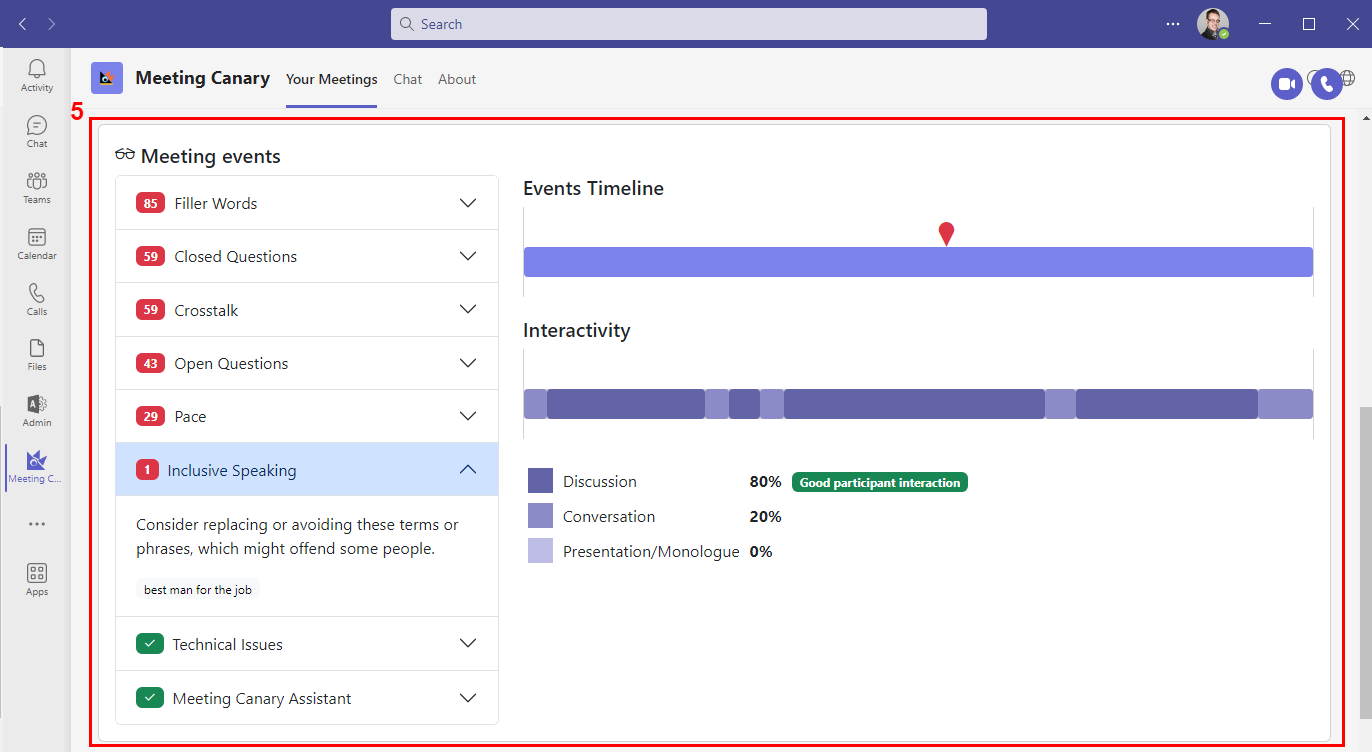
5. Meeting Events
View a timeline of Meeting Events
- Filler Words
- Closed Questions
- Cross Talk
- Open Questions
- Pace
- Inclusive Speaking
- Technical Issues
- Meeting Canary Assistant

Also shows the Interactivity of the meeting. Breaking down how much time is spent in:
- Discussions (3 or more people talking together)
- Conversation (two people talking together)
- Monologuing (single speaker for a long time)
- No Talking (quiet periods).
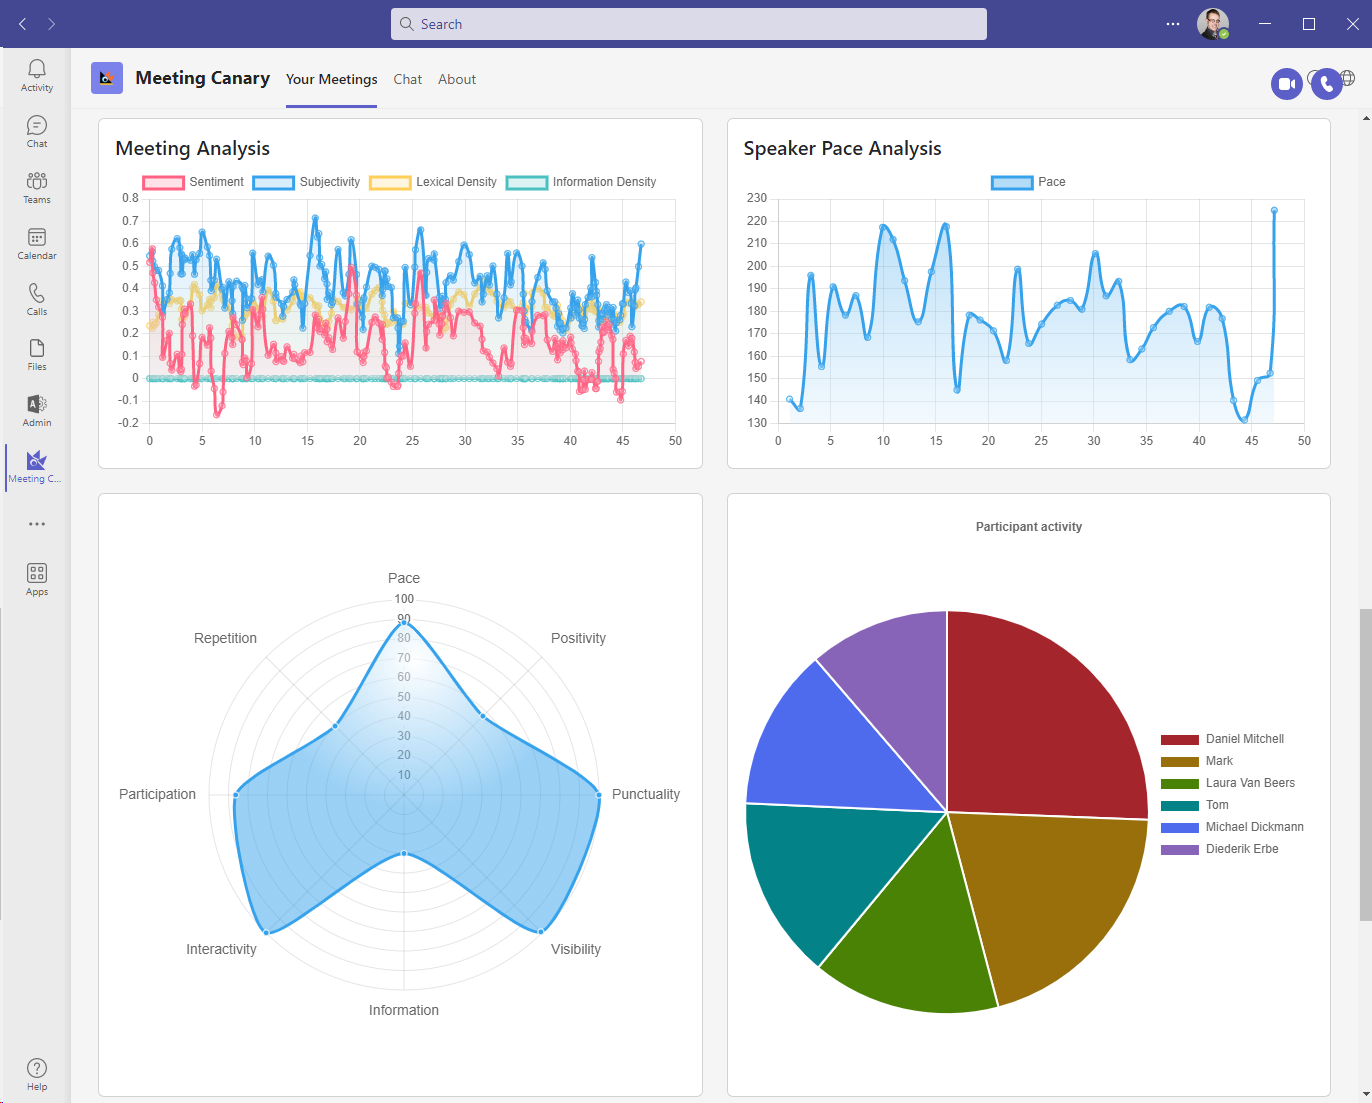
Charts and Graphs
Showing:
- Meeting Sentiment (how positive or negative the meeting was)
- Speaker Pace (Speed of the speaking in the meeting, providing an indicator of the energy in the meeting)
- Spider Diagram show various metrics
- Positivity
- Punctuality
- Visibility (Percentage time people spent with their video turned on)
- Information
- Interactivity
- Participation
- Repetition
- Pace
- Pie Chart of Speaking Time (See who took the largest piece of the time pie in the meeting)
